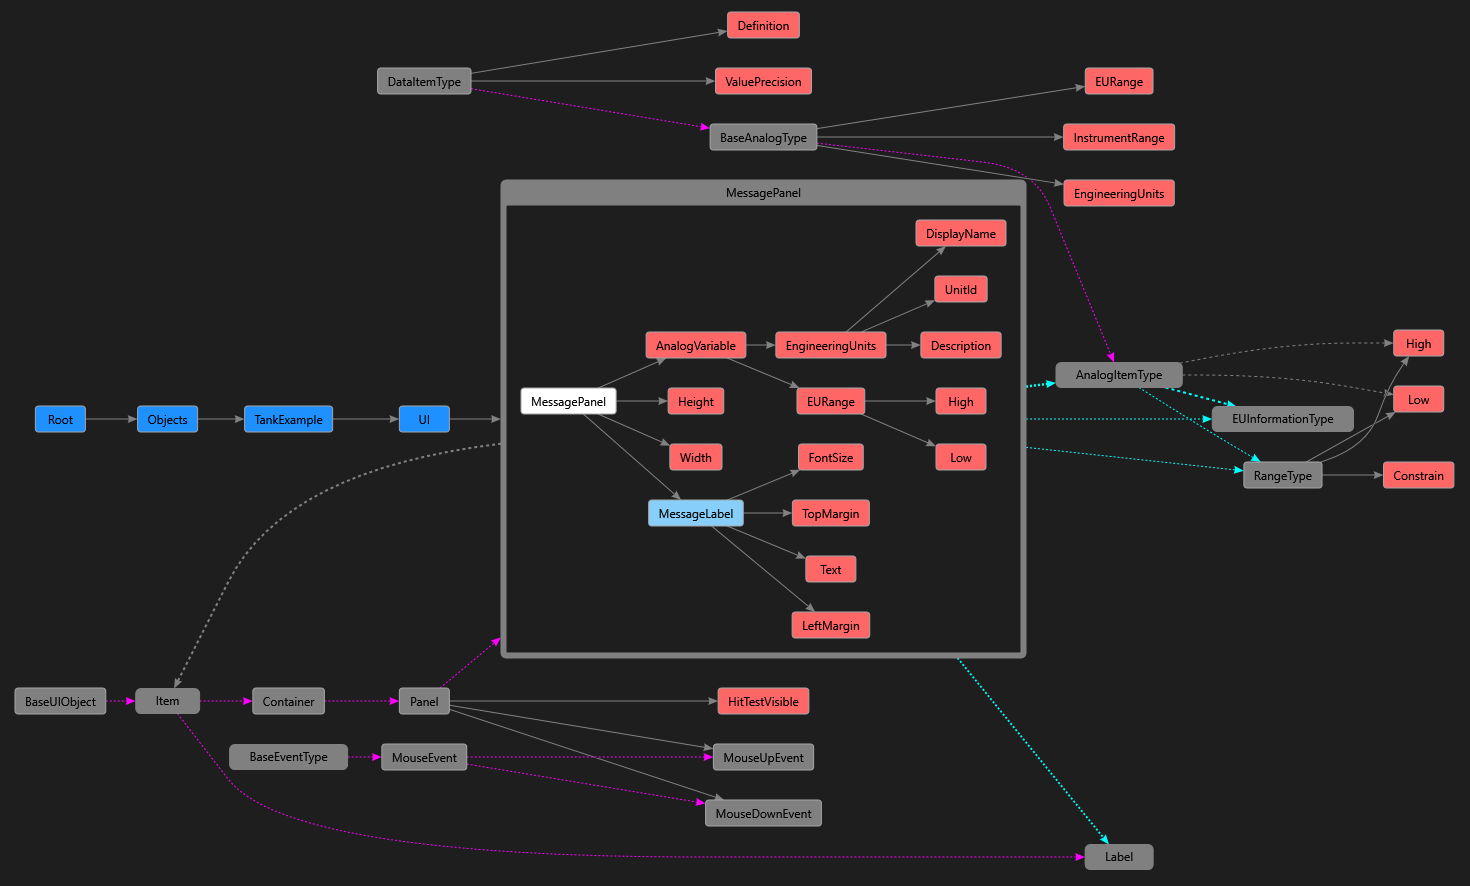
Display information model graphs
Visualize information models of FactoryTalk Optix projects in the form of graphs.
Tip: For more information about project information models, see Information model.
Prerequisites
Install an application that displays graphs DGML graphs, such as Microsoft Visual Studio with the DGML Editor component.
Tip: For more information about DGML files, see Directed Graph Markup Language (DGML) reference - Visual Studio (Windows) | Microsoft Learn.
To display information model graphs
-
Do either:
- In Properties, right-click the property.
- In Project view, right-click the project node.
-
Select Model analysis and then select either:
- Information model graph (Project only). Visualize only nodes, types, and references related to the user project.
- Information model graph (Ignore OPCUA/Core namespaces). Visualize nodes, types, and references of the user project and FTOptix modules namespaces, except OPC-UA and Core namespace.
- Information model graph. Visualize all nodes, types, and references of any namespace.