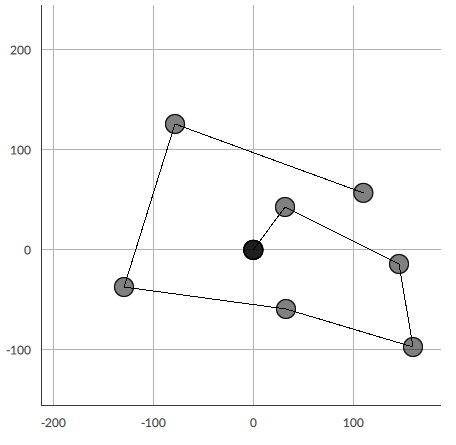
XY Chart
Display the value of two-dimensional variables in a graph.
Use case
Graphically represent or set machine processes, for example the cutting profile or the work area within which a machine can operate.
Tip: You can disable the display of a pen by setting its Enabled property to False.
Example